Energy Transitions Reboot


Summary
- Three energy categories are defined: geological energy, plant biomass, and solar-derived energy.
- Each individual energy paradigm can actually be traced back from the time of its first commercial use to the time of its peak relative demand, with wood, coal, oil, and natural gas peaking respectively in 1750, 1913, 1973, and 2020 (to be confirmed).
- Since the mid-1900ieth century the global demand for primary energy is rising linearly with the global population at a rate of about 24,000 TWh per billion of population count.
- Economic progress is thus defined by improved energy production and efficiency, not by increasing energy consumption per capita.
- If History is a guide, total energy demand will grow from about 167,000 TWh in 2021 to around 215,000 TWh in 2050 just five years ahead of the global population count reaching 9 billion.
- Solar and wind energy growth rate will slow significantly and both technologies combined will barely reach a total of 10 GWh of power supply by 2050, growing from a share of 1.7% in 2021 to about 4.5% in 2050.
- Nuclear energy is expected to experience a renaissance and to add a similar amount of power supply as solar and wind combined.
- Hydrothermal energy and hydropower continue to grow but will both add a lower amount of energy to the mix, about half of nuclear energy or solar and wind combined.
- Plant biomass is going nowhere as burning of traditional biomass (wood) is in a long term decline; the modest growth of modern biofuels will not be sufficient to offset the global use of biomass for energy uses.
- Fossil fuels continue to grind higher but at decennial slowing pace, adding three times more energy than nuclear, or wind and solar, about 24,000 TWh by 2050.
- Fossil fuels will therefore still cover about 78% of the global energy demand by 2050 down from about 86% by 2021, and geological energy (adding hydrothermal and nuclear power) will be at about 83% of the total down from about 88%.
- There is no true energy transition in the making, just a slow and steady evolution of the global energy mix.
- Achieving net zero CO2 emissions by 2050, or even more a reduction of 45% of emissions by 2030, is an impossible mission.
Global Energy Demand
Every energy stakeholder is familiar with the cumulative energy demand of the world showing the absolute dominance of fossil energy sources (Fig. 1). From an historical perspective the global energy demand has only gone up since the dawn of human civilizations to reach an all-time record of about 167,096 TWh in 2021.
Figure 1: Global Energy Demand to 2019 – Source: Our World in Data

Sources of Primary Energy
For the purpose of the present assessment, we are taking a somewhat different view on energy sources than the usual categorization (Fig. 2) by splitting them into the three categories: geological energy, plant biomass, and solar-derived energy.
Figure 2: Energy Categories

Geological Energy
Every type of energy sourced from the interior of the Earth that:
- has been existing since earth's creation about 4.5 billion years ago, i.e. nuclear energy from radioactive materials.
- formed by conversion of carbon-based plant and animal materials through the movement of geological masses (subduction) combined with internal influences (high pressures and internal heat) such as petroleum, coal , and natural gas, that were formed between approximately 540 and 250 million of years.
- is generated through the conversion of geological friction mediated by tidal forces originating in gravitational influences (through the relative and cyclical movements of the Moon, the Earth and the Sun) into thermal energy, i.e. geothermal energy, mostly in the form of hydrothermal energy, with an actual duration of ore-forming pulses on the scale of tens to hundreds of thousands of years (i.e., about 10,000 to 200,000 years).
Solar-Derived Energy (actual Renewables)
Figure 3: Irrigation in Ancient Times | Credit: icid.org

Solar-derived energy sources consist in the direct capture of radiative solar energy that became commercial in the 1990s thanks to concentrated solar power or photovoltaic energy technologies, or through weaker kinetic energy derivatives from the movement of air and water masses such as wind and hydropower. Although employed earlier in human history such as for sailing or irrigation (Fig. 3), wind and hydropower only became commercially widespread at large scale during the last decades.
Plant Biomass
Figure 4: Homo Erectus Using Fire to Make Tools | Credit: Christian Jegou/Public Photo Diffusion/SPL
 Since the dawn of times the main energy source humans have used has been either their own muscle power or in a most recent addition the power from animals such as draft animals used in agriculture since at least 5,000 years. Although significant from an evolutionary perspective, realizing that domesticated animals draw their power from plants, and humans draw theirs from both plants and plant-eating animals, muscle power has not been a decisive factor in the growth of energy use by human societies as it could not be leveraged by being limited to the locally available, low energy yielding food supply. On the contrary a critical contributor in the growth of energy employed has been the invention of fire (Fig. 4) to directly convert the plant biomass, essentially in the form of wood, into thermal energy, that may go as far back as 2.5 million years ago when hominids may have learnt to at least maintain fire.
It is a more recent development to convert plant biomass into biofuels, such as biodiesel or bioethanol. Plant biomass is made of carbon-based materials used in combustible applications that is formed seasonally as a weak derivative of solar energy. We thus ascribe both wood and biofuels to one and the same category, plant biomass.
Time lag for availability of primary energy
The time lag between formation of an energy source and its actual use is shown in Fig. 5 on a log timescale. By virtue of their short availability time lag, dependence on weather conditions and above ground location, both plant-biomass and solar-derived renewables can be seen as the actual renewable sources of primary energy. Solar and wind energy are instantaneously available when the sun shines and the wind blows, water flowing down from rivers is available for hydro-power generation with an estimated time lag from a few hours (in case of flash floods) to approximately ten days in case of slow water movement in very long rivers (although water may accumulate in natural underground reservoirs and leak out into rivers over longer periods of time), whereas plant biomass growth rate stretches from a few months up to 100 years.
Figure 5: time lag for use of an energy source by human society on a log timescale
 Energy that is returned to human society after having been buried for prolonged geological times in the entrails of the planet are defined as geological sources of energy, even though hydrothermal energy is a continuous process of energy accumulation that can be considered renewable. Coal continues to form in swamps around the world today, but the changes it undergoes to become high-quality black coal take hundreds of millions of years, and even brown coal needs tens of millions of years to form; therefore in a sense, fossil fuels can be seen as partly renewable on very long geological timescales as well. Only nuclear energy is stricto sensus non-renewable.
Global Energy Demand by Source
We are now ready to take a look at the global energy demand according to the individual sources of energy (Fig. 6) based on data from Our World in Data to 2019, updated with data up to 2021 from BP's 2022 Statistical Review of World Energy. The fossil fuels demand dip from the 2020 lock-downs and recession period is clearly visible, followed by a sharp rebound in 2021.
Figure 6: Energy Demand by Type of Energy Source to 2019

Biomass and biofuels comprise the sum of traditional biofuels like biodiesel, bioethanol, and modern biofuels such as Hydrotreated Esters and Fatty Acids (HEFA), together with traditional biomass, which is mostly wood, by far the major source of biomass energy. Unfortunately, traditional biomass energy data are no longer updated after 2015, but since its growth rate has been slightly negative at an average of 1% decline per year since 2003, we make the reasonable assumption that traditional biomass energy demand has been steady at 11,111 TWh since 2015.
In order to assess the weight of the various primary energy sources in the energy mix, we convert the absolute demand values into relative demand data as shown in Fig. 7.
Energy from Biomass still Growing in Absolute Terms, but in a Long Term Relative Decline
Biomass-derived energy – essentially consisting of wood burning – is still growing in absolute terms despite energy from traditional biomass stagnating (or most likely declining) due to the development of traditional and modern biofuels. However, energy from biomass has peaked in relative terms in the mid-1800ieth century when coal entered the energy space and has been since then in a long-term, unrelenting relative decline (brown line in Fig. 6), at below 8% of the global energy demand in 2021.
Fossil Energy Crushing Energy Demand
Coal became the dominant source of energy during the industrial revolution when passing the 6,000 TWh mark, taking over from traditional biofuels at the beginning of the 20th century (Fig. 6). Coal demand peaked in relative terms at about 56% of global energy in the 1910s, decreasing to 26.6% in 2021, still more than a quarter of the total (Fig. 7). In a previous assessment we estimated that coal demand may have peaked in 2013 (in absolute terms) at 44,316 TWh (Fig. 6), but meanwhile the global coal demand is set to return to its all-time high in 2022 as it rebounded sharply post Covid-19, the IEA reports.
Figure 7: Energy Demand by Type of Energy Source to 2019

Crude oil peaked at a 46.2% relative share of global energy demand in 1973 to come down to a 35.9% share in 2021, still more than one third of the total (Fig. 7). Oil demand continues to increase steadily after it displaced coal as the main source of energy when passing the 16,000 TWh mark in the mid-1960s and is since then holding firmly to its uncontested leadership role with a demand rising to an all-time-high of 58,381 TWh in 2021 (Fig. 6). Global Oil demand dipped during the 2020 economic crisis, but rebounded sharply in 2021 and surpassed pre-pandemic levels in March 2022, JODI reports.
Natural gas demand has been playing catch up with its fossil peers, vigorously growing to an all-time-high value of 40,369 TWh in 2021, unfazed by the Covid-19 pandemic (Fig 6). From 2000 on the pairing of hydraulic fracking with horizontal drilling started a massive increase of natural gas production, essentially in the USA. In relative terms however, we may also have experienced natural gas relative share of global energy demand peaking at 24.3% in 2020 as it came back to 24.2% in 2021 (Fig. 7), although will need to be confirmed.
Figure 8: Relative Share of Energy Demand to 2021 (fossil fuels comprise oil, coal and gas; Geological energy comprises fossil fules plus nuclear and hydrothermal; all renewables comprises biomass including modern biofuels, plus solar, wind and hydropower; all others include all renewables plus hydrothermal, and nuclear)
 Collectively, fossil fuels are crushing every other source of primary energy since they hold an 85.6% share of global energy demand in 2021, a level that has not been violated to the downside since the year 1976 (Fig. 8), although they probably have made their peak in relative terms at 86.9% of the global energy demand in 2012. Adding the 1.6% of nuclear energy share and the meager 0.4% of hydrothermal power share to the total, then all geological energy sources collectively cover 87.8% of the global energy demand, after hovering above the 88% level for almost two decades.
Other Geological Energy Sources are Minor Contributors
Nuclear energy is a special case since energy demand from nuclear power plants has been flat for the last 20 years between about 2,350 and 2,600 TWh but increasing again from a trough in 2013 post-Fukushima disaster in 2011 and it is about to take out its 2006 peak value of 2,663 TWh, 3 TWh short of this objective at 2,660 TWh by 2021.
Figure 9: A geothermal plant in Iceland | Universal Images Group via Getty Images

Solar-Derived Renewables Fast-Pace Growth from a Very Low Threshhold
Solar-derived renewables (direct solar, wind and hydropower as defined in Fig. 2 above) are cumulatively the fastest developing energy contributors, growing in the aggregate at an average annual growth rate (AAGR) of 6% over the past 15 years and covering a global demand of 7,096 TWh in 2021. It is noteworthy that among solar-derived renewables, hydropower still holds the lion's share with 60% of the total despite the faster growth rate of wind and solar energy. Solar, wind and hydropower collectively hold a 4.2% relative share of the total energy demand, and solar and wind combined a 1.7% relative share.
Technology Transitions
Energy demand growth as depicted in Fig. 1 is often decried as non-sustainable due to the need to gain access to unlimited resources in a finite world and the associated increase in CO2 emissions. It therefore becomes a prerequisite to assess if global energy demand is indeed growing exponentially.
Technology transitions are typically made of a succession of individual S-curves adding up into a long term exponential curve, which is a typical characteristic of a longer term “exponential” growth trend (Fig. 10)
Figure 10: S-Curves & Exponential Trend | Source: Singularityhub.com | Examples: our own
 It should also be noticed that older technologies do not necessarily disappear but may instead simply lose significance or progressively become marginalized. Such is the case with wood burning, the oldest form of primary energy, and horse riding, the oldest travel mode, that we cannot fail to observe are still in use today.
This is where we come to realize that the global energy demand trend seemingly shares apparent similarities with other exponential trends of technological progress with successive shifts of paradigm stacking upon each other and with former champions still fighting in minor leagues.
As a consequence therein lies the expectation for energy demand to pick up again after a long transition period, which started during the Covid-19 recession and which consequences have been amplified by a swathe of subsequent geopolitical, economic and weather upheavals. Such a technological transition in the energy space would be justified by cost reduction and energy efficiency increase brought about by the mass adoption of an emerging technology that will subsequently grow to a larger scale than more expensive, less efficient previous technology generations.
Each individual energy paradigm can actually be traced back from the time of its first commercial use to the time of its peak relative demand.
- Thus it is possible to envision that wood became traded early in the history of human civilization as soon as the division of labor and tasks specialization developed, probably several tens of thousands of years ago at least and it remained practically the exclusive source of energy until coal started to be used commercially, which can be traced back to the year 1750.
- Relative energy demand from coal peaked in its turn around 1913 (Fig. 7).
- Crude oil became exploited commercially for energy for the first time in 1856 before peaking in relative terms in 1973 as we have seen.
- Natural gas, although used earlier at smaller scale and locally, became a traded commodity when long-distance gas transmission became practical from 1927 on because of advances in pipeline technology. With the sharp coronavirus pandemic-induced demand drop of 2020 the question arises if this may have sealed the fate of the natural gas relative share of total energy demand or if the sector may become re-energized in the years to come.
- The birth date of modern solar-derived renewable (for electric power generation) can be established as 1881 when the old Schoelkopf Power Station No. 1, US, near Niagara Falls, began to produce electricity.
- The nuclear energy era started when the world's first nuclear power station-the Obninsk Nuclear Power Plant in Russia-was connected to the power grid on 27 June 1954.
From these milestones, energy demand trends (Fig. 6) and relative demand relationships (Fig. 7) we can establish a time line for energy paradigm shifts (or energy transitions) according to:
- Biomass: tens of thousands of years to 1750
- Fossil fuels: 271 years from 1750 to 2021 ongoing
- Coal: 163 years, from 1750 to 1913
- Modern solar-derived renewables, hydropower, solar and wind providing electric power: 141 years, from 1881 ongoing
- Oil: 117 years, from 1856 to 1973
- Gas: 94 years, from 1927 to 2020 or ongoing (?)
- Nuclear energy: 68 years, from 1954 ongoing (?)
As we can see from this list and Fig. 7, only three paradigm shifts have actually taken place (text underlined here above) from wood to coal and from coal to oil, but only one if fossil fuels are considered as a unitary source of energy. The comparative duration of an energy paradigm now makes clear that the global demand for primary energy proceeds via a series of successive technology-driven energy transitions, which tend to happen with a shortening duration. The biomass age lasted tens of thousands of years, but the fossil fuel age is younger than 300 years and probably not going to end any time soon.
Total energy demand plotted on a semi-logarithmic scale of energy demand (Fig. 11) now emphasizes the succession of bumps occurring at every transition period, from wood to coal, and from coal to oil, with the present day situation now having the look of yet another energy transition possibly in the making, which is what we are exploring next.
Figure 11: Energy Paradigm Shifts - Is a New One in the Making?
 As global energy demand starts being reported on an annual basis from 1965 on, episodes of demand drop intervening in the longer term uptrend become visible. Following the oil embargo of 1973 total energy demand practically stalled in 1974 but to rapidly resume its growth, then it actually declined after the oil price peak in 1980 but to recover and resume growth only three years later. The latest event in this series is the most recent slump during the Covid-19 episode and the subsequent ongoing recovery. The peaks and troughs of energy demand during the chaotic and stagflationary decade from 1973 to 1983 are coincident with the oil paradigm.
Annual declines in global energy demand are rare events running against the continuously rising energy demand on the longer time scale from the dawn of civilization and its acceleration over the last few centuries. The decline in energy demand during the 2020 coronavirus pandemic and global economic crisis shall become identified as another major event preluding to yet another possible energy paradigm shift.
Global Energy Demand Growing Exponentially... or Not
We should as well attempt to forecast the robustness of the global energy demand growth trend depending on the order of the trend equation growth factor. Is energy demand actually growing exponentially or not? Clues are provided by plotting possible trend lines upon the plot of global energy demand against time (Fig. 12).
Figure 12: What is the Type of the Global Energy Demand Growth Trend?
 The choice to extend the timescale to 2050 in Fig. 12 is not innocent since it corresponds to the United Nations' objective as called for in the Paris Agreement to reduce carbon dioxide emissions by 45% by 2030 and to reach net zero emissions by 2050.
- An exponential growth trend (pink curve) does not really look like a good match with the demand curve but if it were fitting, then the 2050 energy demand of the world would reach 280,000 TWh, a 68% increase over 2021 demand.
- The linear trend since the mid-20ieth century appears to better fit the actual growth curve and when extended to 2050 indicates that global energy demand will reach 220,000 TWh, still a 32% growth compared with 2021.
- The last possibility is a slowing demand for energy over the coming three decades, in which case energy demand would realistically reach 200,000 TWh by 2050, a mere 20% increase compared with 2021.
The correct answer probably lies somewhere in between and we can resort to another form of data engineering to refine our forecast.
Population Size Matters
Energy demand is intrinsically related to population size that is expected to grow to 9 billion by 2037 and 10 billion by 2055 (Fig. 13) according to a combination of data from Our World in Data and from the UN Department of Economic and Social Affairs.
Figure 13: Historical and Predicted World Population

It now appears that the purportedly exponential growth in energy demand is actually an artifact finding its origin in the linear correlation between population size and global energy demand. Since the mid-19ieth century the global demand for primary energy rose in lockstep with the global population inside a broad linear channel with a slope of approximately 24 TWh per billion of population count (Fig. 14).
Figure 14: Energy Demand is Growing Linearly with Population Size

If History is a guide then we should expect the average energy demand of the World to reach approximately 195,000 TWh when the population count of 9 billion is reached by 2037 and 220,000 TWh when population reaches 10 billion by 2055.
The 2050 energy demand forecast therefore likely lies somewhere in between the linear trend and slowing trend targets shown in Fig. 12, possibly closer to about 215,000 TWh, which raises the issue about the plausibility of achieving net zero energy production by 2050, or even more a reduction of 45% by 2030, which is a daunting if not entirely unattainable target, whereby the IEA predicts that petroleum and other liquid fuels will remain the world’s largest energy source in 2050.
The Next Energy Contender(s)
As it now becomes clear that the world will likely add 45,000 to 50,000 TWh to the energy mix by 2050, not in production capacity terms, but of actual production to satisfy the growing energy demand of the world, it becomes essential to identify the energy contenders that will make this possible. A prerequisite is to understand how primary energy sources are used. For this purpose we rely on Our World in Data's 2019 electricity mix analysis, the 2019 version (for the sake of consistency) of the BP' Statistical Review of World Energy, complemented with our own estimate for traditional biomass use.
Figure 15: Global Energy Mix - Electric Power and Other Uses

Biomass Use for Energy is not Going Anywhere
Modern biofuels make just 2,280 TWh or 1.36% of the global energy demand in 2021 with a subdued growth rate compared with the sharp increase during the 2010s, as shown on a semi-log chart (Fig. 16). Their growth is essentially policy driven through mandates as well as various incentives such as subsidies, grants and guaranteed loans. In Europe the Renewable Energy Directive (RED II) mandates renewable energy to make up 32% of the consumption mix by 2030, and a minimum of 14% renewable energy in road and rail transport among E.U. members by 2030.
Figure 16: Growth of Energy Made from Modern Biofuels
 The Covid-19 induced economic crisis, supply chain disruptions, the recent commodity price increases and food production concerns have stalled development projects and their average growth rate is now trending down below the 5% mark. Modern biofuels could possibly double until 2050 but since burning of traditional biomass is at best stable but most probably in a steady decline due to technological improvements and modern energy production deployments in developing and emerging countries, the relative contribution of biomass to global energy demand is likely to continue declining on the long term (Fig. 7). From a humanitarian perspective it is a positive development putting an end to hazardous wood burning that has been plaguing the world's poorest populations with no access to modern energy sources. Biomass as a whole is definitely not a disruptive contender in the energy space as the world is approaching sooner than later the very end of the biomass-based energy age (Fig. 7).
Hydropower is Slowly Creeping Higher
Among solar-derived renewable sources of energy, hydropower is the largest contributor with a 2.5% share of the total whereby solar and wind are at 0.6% and 1.7% respectively. The striking difference is that hydropower share of energy demand has not budged for many years as it averaged 2% growth for the last seven years.
Figure 17: Three Gorges Dam, Yangtze River, China | Via industrytap.com
 Hydropower, as the name implies, produces exclusively electrical power and is subject to weather fluctuations such as the droughts of the summer 2022 experienced in Europe, China and the USA. Technically feasible hydropower potential estimated at nearly 15 000 TW h/yr in 2002 still exists in the world today, mostly in countries where increased power supplies from clean and renewable sources are most urgently needed to progress social and economic development If hydropower was to maintain its previous growth regime it could almost double from 4,231 TWh in 2021 to between 7,000 and 8,000 TWh in 2050, exhausting about one fith of its remaining development potential.
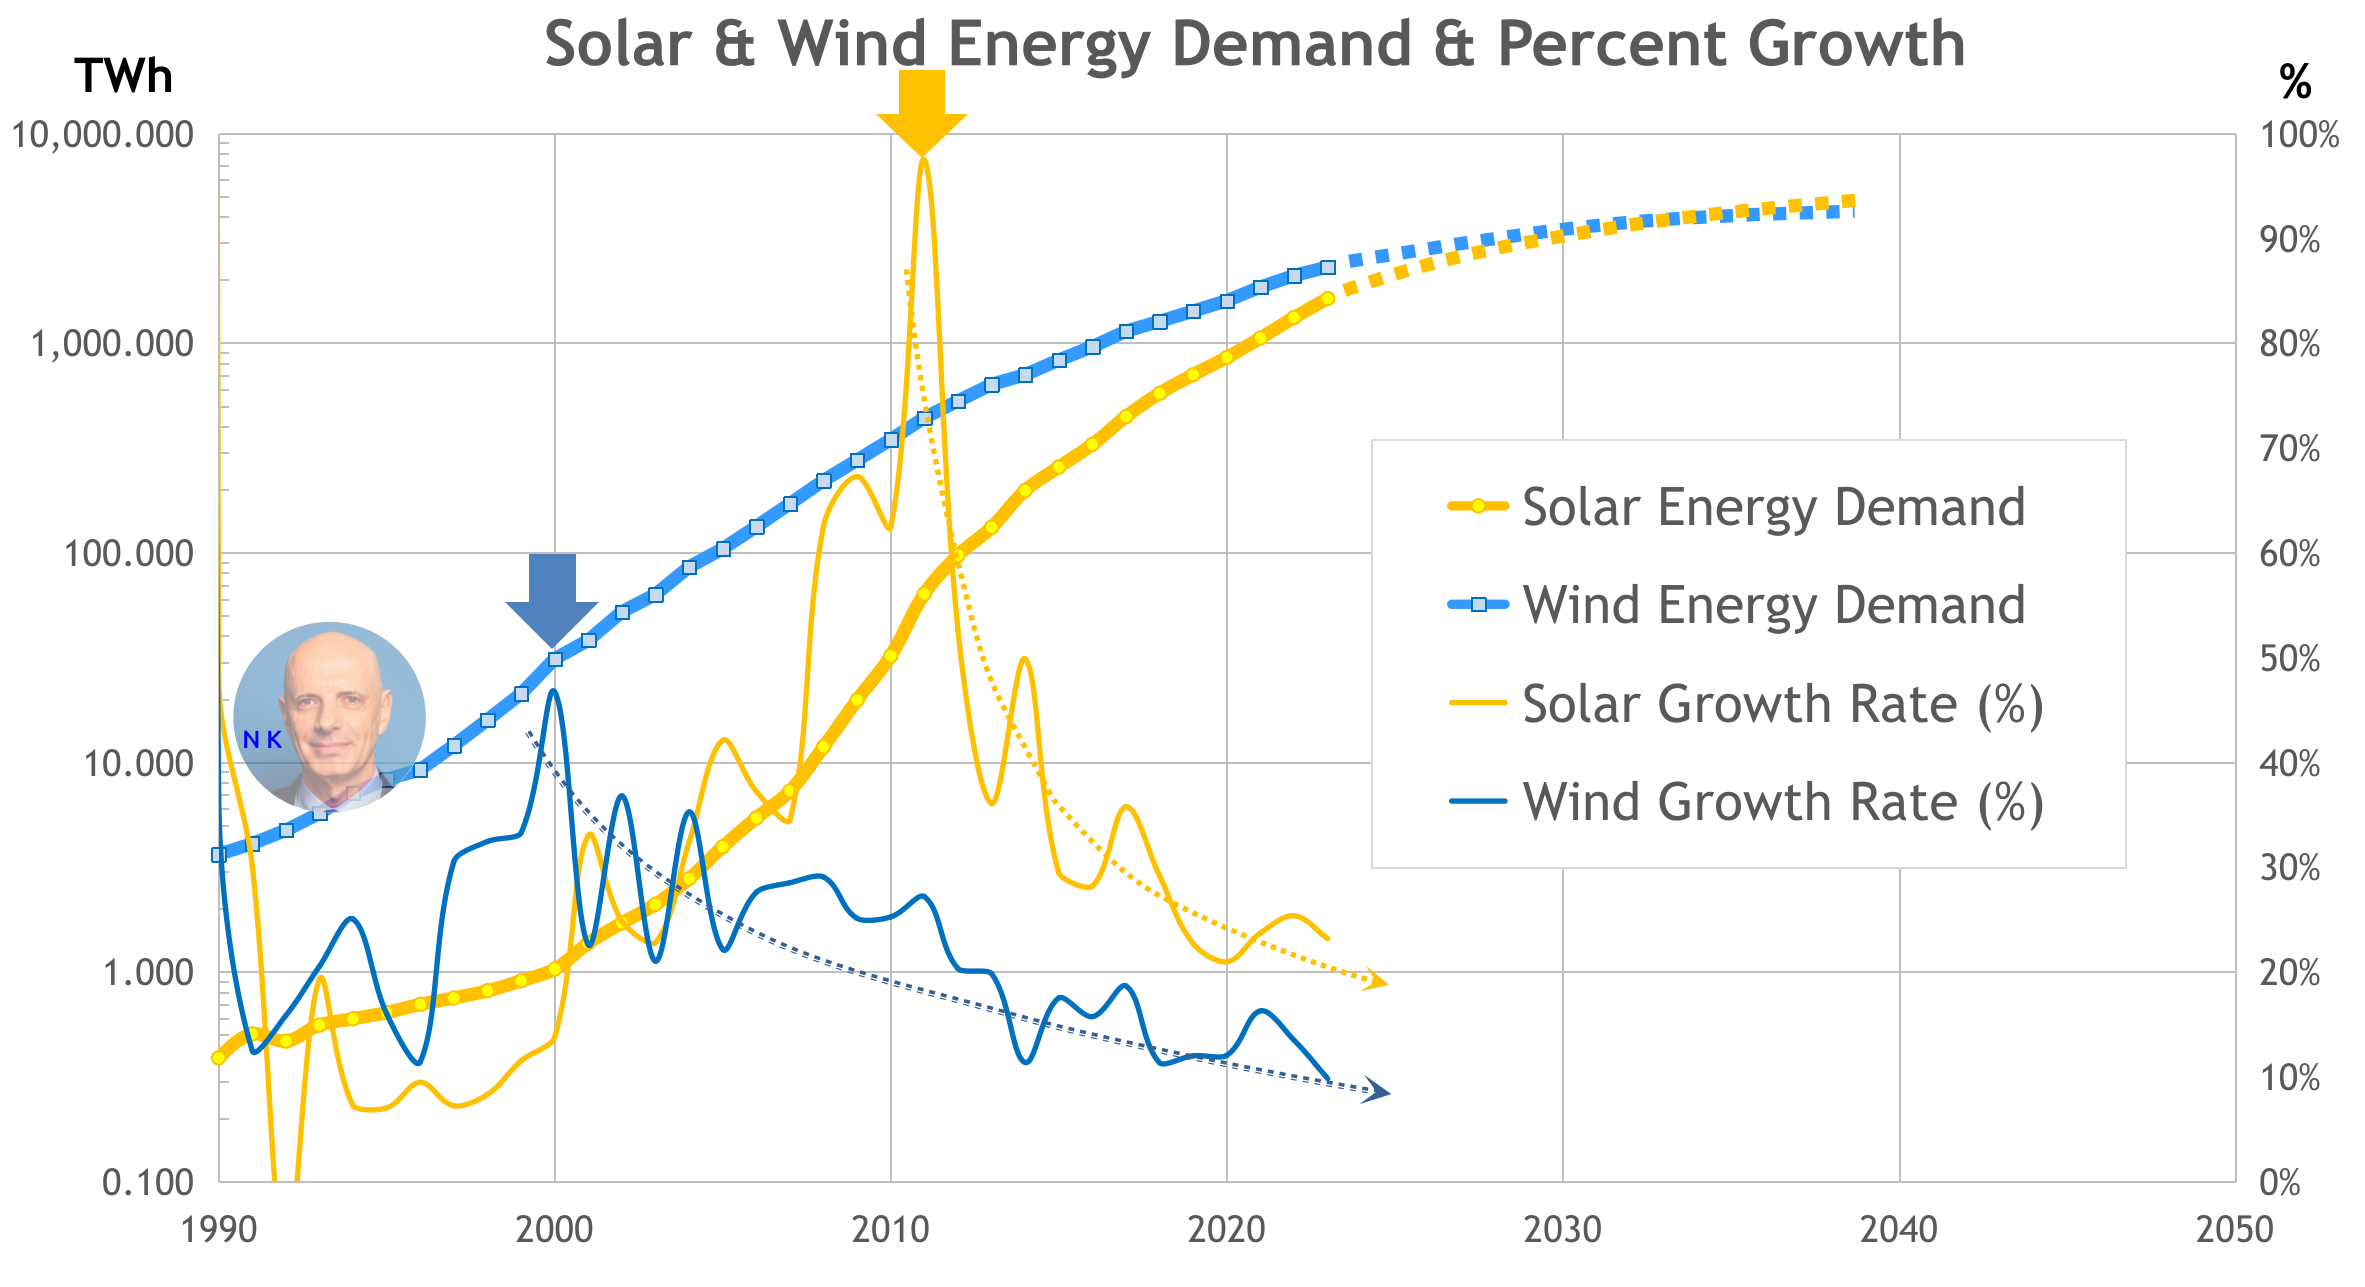
Solar and Wind Growth Rate Slowing
It is frequently reported that solar and wind are growing exponentially due to the significant increase in newly installed capacity year over year. In reality, the semi-log energy demand chart combined with the growth rate curves clearly demonstrate that the inflection point of the hockey stick curves marking the end of the exponential growth phase has passed many years ago, in 2001 in case of wind and 2014 in case of solar. The energy demand growth rate from both technologies is in a steady decline since these dates (Fig. 18).
There is no denying that solar and wind are the two most dynamically growing technologies with their respective growth rates sitting at 22% and 17% in 2021 and their share of the total energy demand rising steeply since they became commercially available at scale by the start of the 1990s. After decades of commercialization, solar and wind combined provide in 2021 just 1.7% of the global energy demand (1.1% in case of wind and 0.6% in case of solar) with respectively 1,843 and 1,022 TWh despite extensive incentive schemes and subsidies allocated to their development.
Figure 18: Growth of Energy Made from Solar and Wind Installations
 Solar and wind installations are exclusively employed for electric power generation at this stage by feeding power into the electric grid and providing in 2019 about 8% of the world's electricity as a global average (Fig. 15). They are now suffering from a gradual growth rate erosion of new installations as they are deployed at larger scale to supply a bigger share of electricity in some countries. Complications arising from necessary energy production plant back-ups with conventional technologies, mostly gas or combined cycle power plants due to the intermittency of solar and wind energy production as the recent weather conditions in both the US and Europe over the last two years and most recent energy crisis in Germany have revealed, which is not really in favor of wind and solar growth re-dynamisation. We forecast instead that growth will continue to decline dramatically over the coming decades.
If the energy trend extrapolations plotted (Fig. 18) are accurate then solar and wind will together barely reach 10,000 TWh of electric power generation by 2050 (noting that the energy scale in Fig. 18 is logarithmic), a far cry from the singular IEA's prediction that the supply of wind power will grow approximately 4 times and solar energy demand will increase about 25 times between 2020 and 2050.
Hydrothermal Power Growing Exponentially but from a Low Threshold
Figure 19: Exponentially Growing Demand for Hydrothermal Power

Hydrothermal power growth is beautifully exponential (linear plot on a semi-log scale with a correlation factor of 0.9965 in Fig. 19) since 1965, but with a demand of just 725 TWh in 2021. At an average growth rate of about 6% per year, the trend extrapolation indicates that hydropower could add about 4,000 TWh of additional power supply by 2050 if this growth regime is maintained, not a sufficient number however to be considered a serious energy contender. Hydrothermal power, as the name implies, can only provide thermal power such as for industrial processes or district heating.
A Nuclear Renaissance
Decades of anti-nuclear activism, bloated safety regulations and strict environmental policies have more than tripled the cost of building a new Nuclear Power Plant (NPP) and increased project schedules to more than 10 years in some instances.
Figure 20: How Safe is Nuclear Energy?

Recently, nuclear energy is returning to grace as it is gaining a lot of attention and gaining the favors of both investors and environmentalists. On the eco front, 'nuke' becomes recognized as an ideal decarbonising energy source since it has one of the lowest carbon footprints and the E.U. recently moved to label nuclear as sustainable, and the latest IPCC report highlights that rapid nuclear development is key to address net zero. From an investment's perspective nuclear power is on the brink of a $1 trillion resurgence, and the world’s rich have entered a new race towards commercial nuclear power.
Figure 21: Hinkley Point C (HPC) is the first nuclear power station to be built in the UK for a generation | Source: laingorourke.com
 The 2022 energy supply crisis is now reshuffling the cards by reprioritising energy projects and accelerating plans for nuclear power development throughout the world, such as China planning to build at least 150 new nuclear reactors until 2035, more than the rest of the world in 35 years, or 10 new reactors per year, on average. It reaches the point that politicians are reevaluating the German nuclear exit planned for the end of 2022, and California is reconsidering the closure of its last large electric plant, the Diablo Canyon nuclear plant
With safety concerns alleviated, regulatory hurdles simplified, nuke opposition tamed by economic necessity and the inclusion of nuclear energy in the portfolio of sustainable power generation a renaissance of nuclear power is likely ahead. We are therefore over-optimistic on the growth rate of nuclear power supply that is expected to increase throughout the coming decades and beyond. On Fig. 22 a decades long path of penance since the mid 1980 is observed when nuclear power almost stagnated until 2010, with the final blow following on the 2011 Fukushima catastrophic event causing a dramatic dip in 2012. In 2021, nuclear power demand has recovered to 2,660 TWh and is on the brink of taking out its 2006 record at 2,663 TWh, which could signal the starting point of a nuclear power resurgence and an accelerating growth trend.
Figure 22: An Expected Renaissance of Nuclear Power

Hard to say, but if this prediction comes true, it is very likely that nuclear power could grow to multiple times its current size. The world added 1,000 TWh of supply in about 6 years in the 1980s. With technological advancement, the speed of deployment could very well become much faster from the 2,660 TWh of nuclear energy demand in 2021. Nuclear power is not yet at the stage where it could be the next energy disruptor but it certainly has the hallmark of a serious challenger rising up during the second half of the 21st century.
In the end mankind has always moved from a more diluted to a more concentrated form of energy. With a density of 3,900,000 MJ/kg Uranium-235 is 35,000 times more energy dense than natural gas (55 MJ/kg), 43,000 times more than crude oil (44 Mj/kg), 79,000 times more than coal (24 MJ/kg) and 119,000 more than wood (16 MJ/kg).
What to Expect from the Fossil Fuel Champions?
Both coal and gas are used for heat as well as for electric power generation (Fig. 15), whereas crude oil is almost exclusively used in refineries, where it is converted into fuels such as gasoline, diesel, fuel oil and kerosene providing power to most of the world's heavy industrial machines, agricultural equipment, light and heavy ground vehicles, ocean going vessels and airplanes. Mobility, transportation, and many industrial activities are outright impossible and the world economy would come to an immediate standstill absent fossil fuels, which replacement with other primary energy sources is outright impossible with the present state of technology and economic configuration.
As we have seen fossil fuels collectively provide in 2021 short of 86% of the global energy supply (Fig. 8) although we believe they have peaked in relative terms at 86.9% in 2012. Both crude oil and coal are well below their peak share as coal peaked in the 1910s and crude oil in 2021. Natural gas may have peaked at a 24.3% share of the global demand in 2020, which remains to be confirmed.
Fossil fuel resources are vastly available but become increasingly difficult to produce considering the scale of their deployment. Just to give the reader an idea, the world consumes roughly 100 million of oil Barrels Per Day (bpd), corresponding to more than 5.3 billion of tons per year. A mere increase of 1% or 1 million bpd means putting in production 5.3 million tons of new oil rigs and requires building one largest capacity mega refinery, or multiple smaller refineries, every year. This does not yet take into consideration the development of coal and gas production capacities, neither the deployment of new power plants.
Figure 23: Oil & Gas Upstream CAPEX vs. Year Previous Oil Price

The main challenges facing the fossil fuel sector is capital availability and risk taking to invest considering large and lasting price swings, long projects lifetime up to 50 years, unpredictable policy changes and permitting whims, and randomly changing regulatory constrains such as environmental regulations. Since the mid-2020s ESG strategies, carbon emissions concerns, climate change regulations and disincentivisation of investment in the carbon-based economy such as carbon credits have resulted in a dearth of fossil fuel investments, at least in the Western world, pushing fossil fuel production capacity utilization to their limit and boosting oil and gas and other commodity prices to record levels during the economic recovery post-Covid-19 slump. We believe however that the economic impact of fossil fuel prices will result in capital allocation returning to the sector as it historically always does (Fig 23).
Figure 24: Fossil Fuels (Oil, Coal and Natural Gas) Demand and Growth Trend

Fossil fuel demand remains in an unrelenting growth trend although with a declining rate of growth that frequently turns negative with deepening values in times of economic crisis but to rebound significantly thereafter (Fig. 24). The tentatively depicted growth rate average, although trending down, is not going to turn negative and the fossil fuel demand is not peaking any time soon, but rather the growth rate will slow down over the coming three decades and demand will be grinding slowly higher until 2050. Even at a 1% average growth rate over the period, fossil fuels are expected to add another 25,000 TWh growing from about 143,000 TWh in 2021 to the mid-167,000 TWh in 2050.
The Energy Mix by 2050
Let's sum up the above conclusions and forecasts with a simple calculation to get a rough idea about the 2050 energy mix:
- Global energy demand in 2021: 167,096 TWh
- Biomass: 0 or negative contribution, let's take 0 TWh
- Hydropower: +4,000 TWh
- Solar and Wind: +8,000 TWh
- Hydrothermal: + 4,000 TWh
- Nuclear: +8,000 TWh
- Oil, Coal and Gas: + 23,904 TWh
- Global Energy demand in 2050: 215,000 TWh
On this basis fossil fuels would see their share of total energy demand decreasing from 85.7% in 2021 to 77.7% by 2050, and the sum of geological energy (adding nuclear and hydrothermal power) would come down from 87,7% to 83,3%, a long stretch away from any significant energy transition and out of range of net zero emissions targets.
Conclusion
Fossil fuels will continue their grind higher at a slowing pace over the next decades. Solar and wind energy growth is expected to slow significantly and to add a modest amount of energy to the mix compared to what is required for 'greening' the economy and reach the net zero objective by 2050. Nuclear is expected to experience a renaissance and to add a comparable amount of energy supply as solar and wind combined by 2050. Both hydropower and hydrothermal energy will add a similar amount of energy supply, about half of nuclear power, or solar and wind combined, by 2050. Fossil fuels will retain their absolute dominance of the energy sector by providing around 78% of the global energy demand by 2050, decreasing from about 86% in 2021. With technological improvements and energy sources diversification we expect energy to become more abundant and cheaper within the next two decades with complementary efficiency improvements throughout all sectors accelerating the trend towards more aggregate consumption, not less.
|
Kokel, Nicolas
6/12/2024 12:16 PM
I have now updated the wind and solar energy demand and growth based upon data sourced from Our World in Data originating from Ember (2024) and Energy Institute - Statistical Review of World Energy (2023).
Obviously this is not the case as the growth rate is in a declining trend (thin doted lines) from peak growth rate years, meaning that every year the growth factor is lower than the year before on average. This demand growth attrition is obviously NOT exponential, which allows us to maintain our forecast of renewable energy demand flatening out as years pass and the ultimate share of wind and solar energy to be significantly below expectations. |